.png)


Turn clean energy into measurable carbon value.
Start measuring today for a valued tomorrow.
Data Harvest
Visualization

Costing


Ultrasonic Sensors

.png)
Water level Sensor
Monitor temperature records across multiple sites with our easy-to-use dashboard. Each project site is labeled for quick reference, displaying real-time temperature.
.png)
Automation Sensor
Monitor temperature records across multiple sites with our easy-to-use dashboard. Each project site is labeled for quick reference, displaying real-time temperature.
.png)
Water level Sensor
Monitor temperature records across multiple sites with our easy-to-use dashboard. Each project site is labeled for quick reference, displaying real-time temperature.
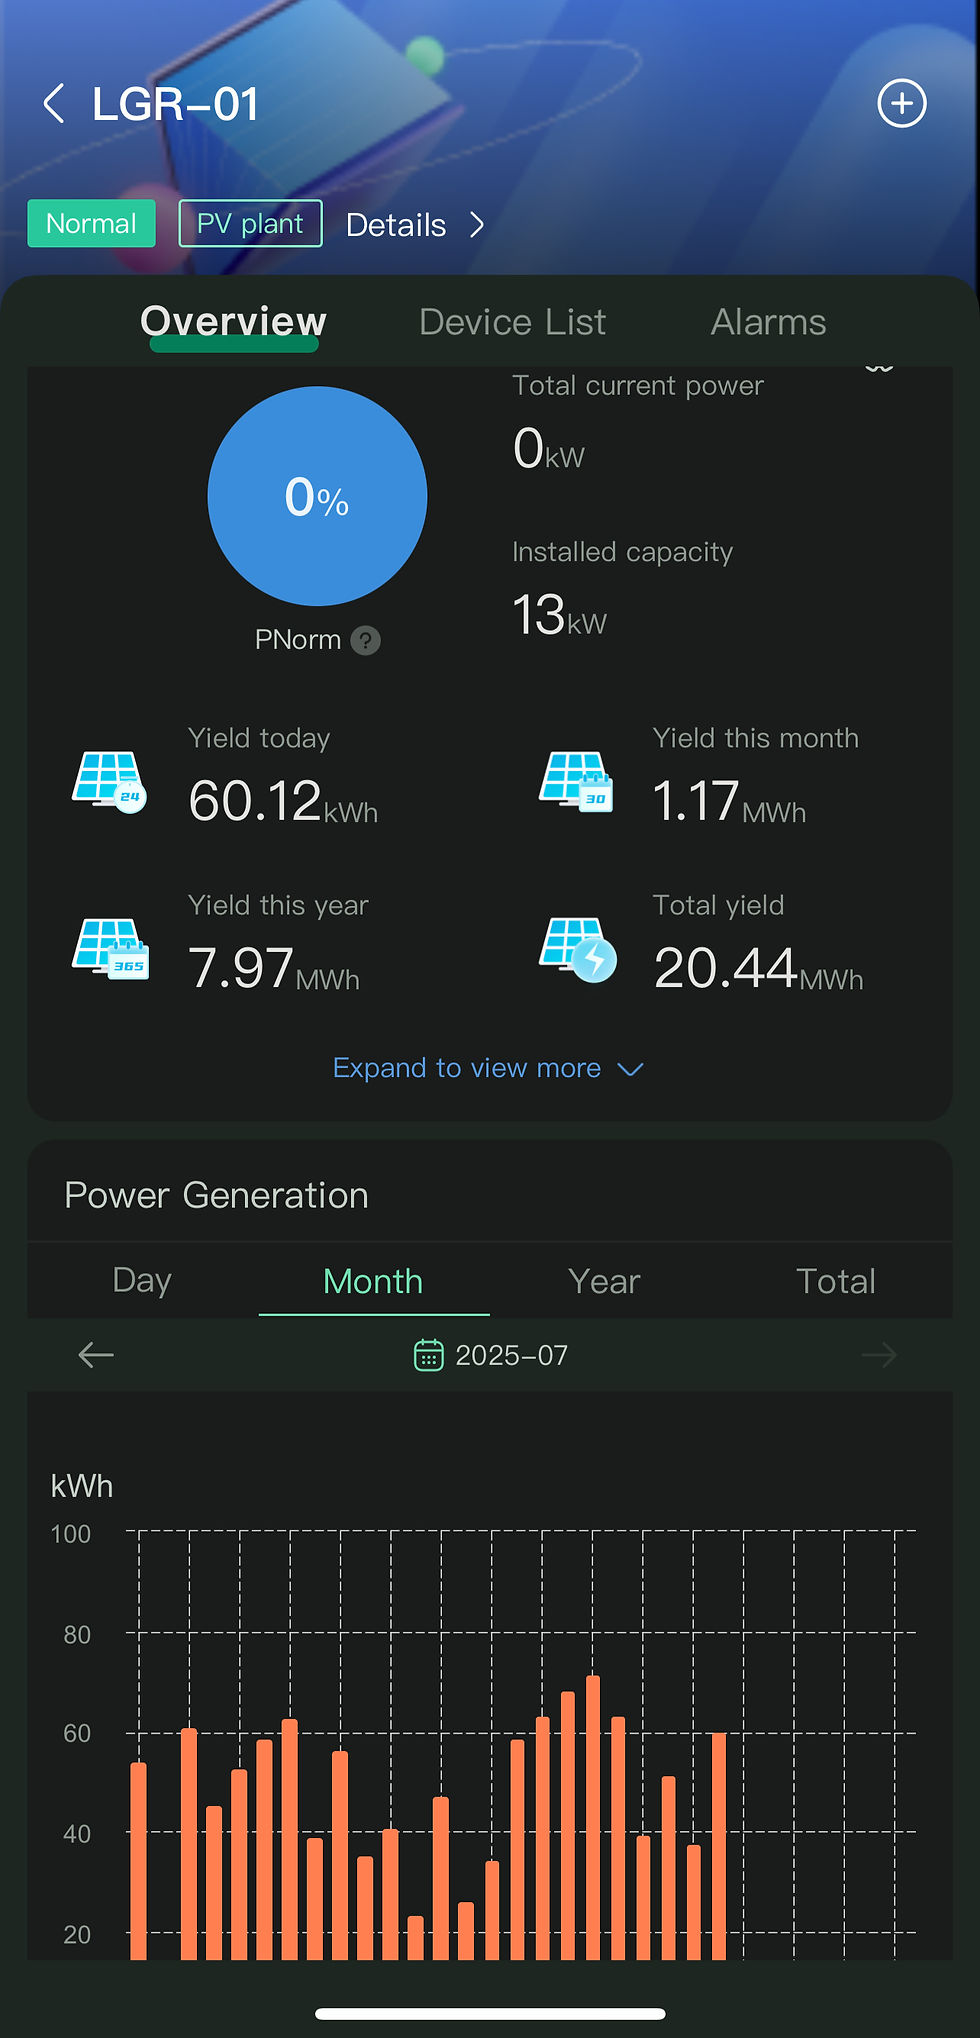
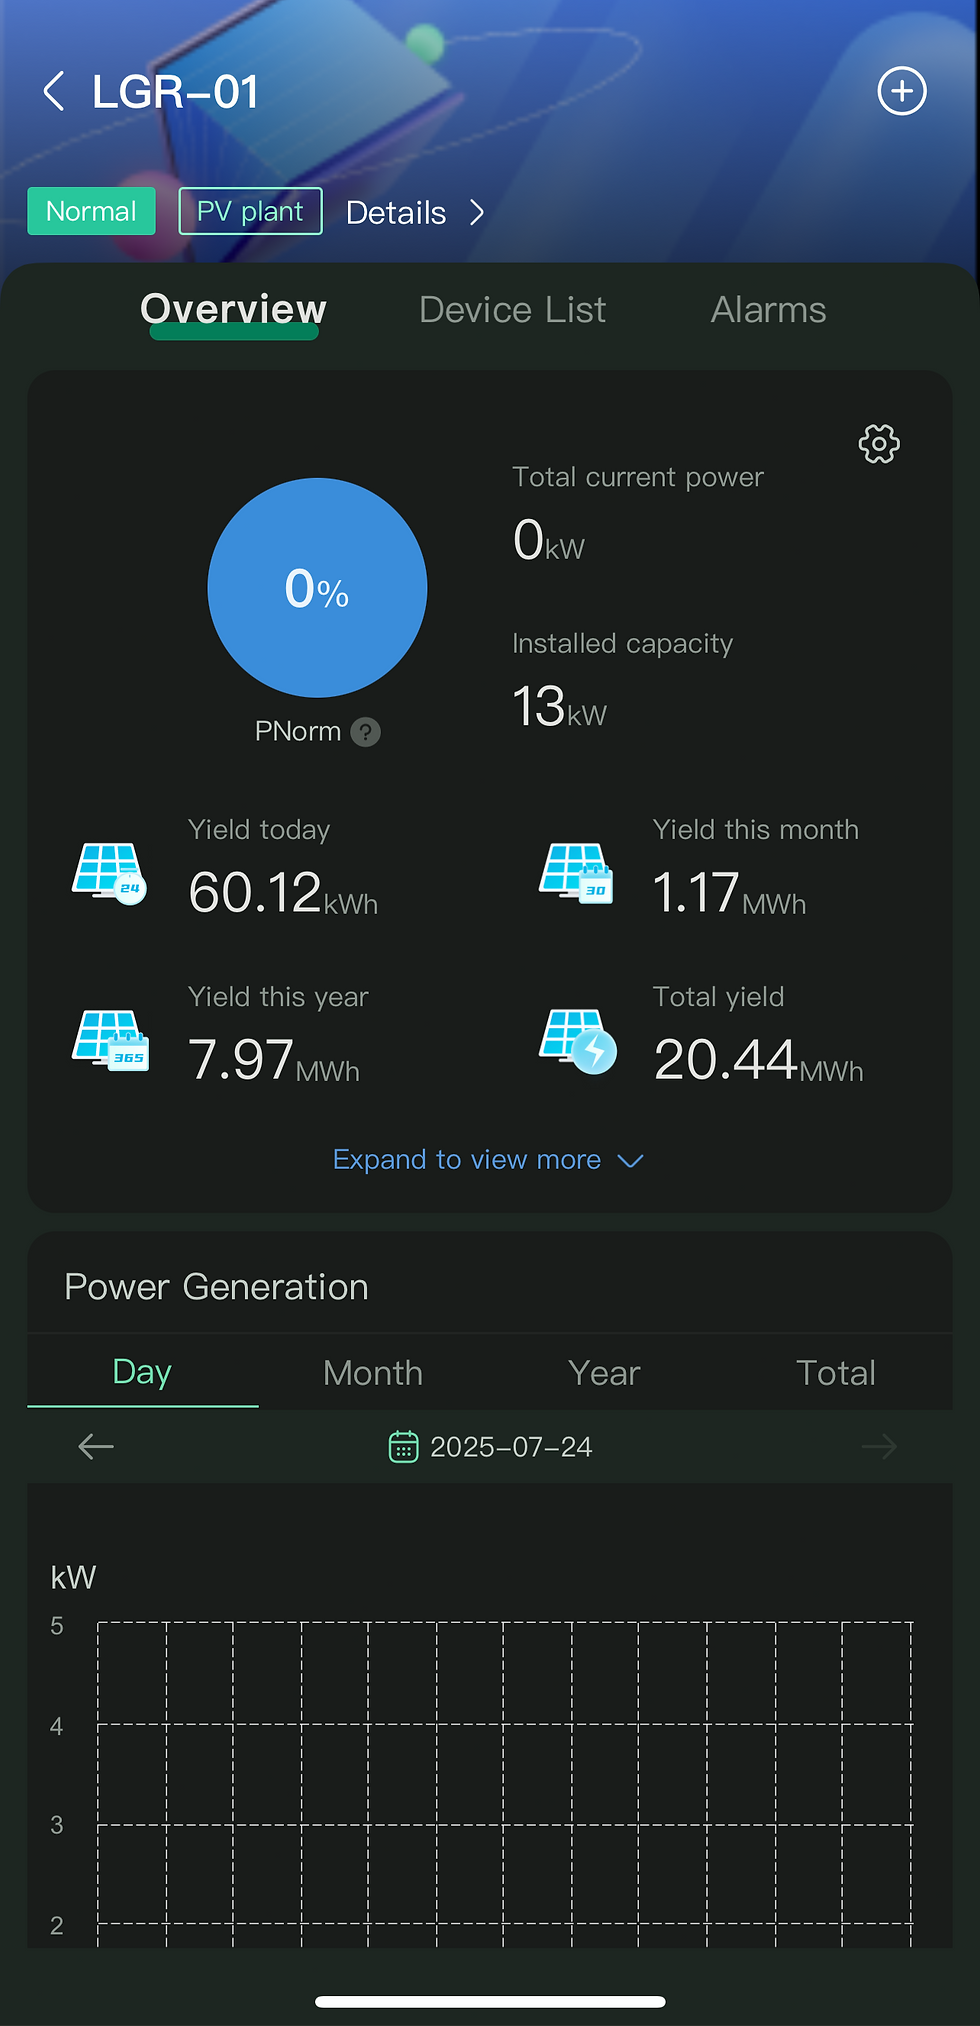
Dashboard
LGR's Unified Visual Dashboard provides real-time monitoring and control of the Automated ECM System. Designed for efficiency and precision, it offers supervisors a clear, data-driven interface to ensure optimal system performance. With the ability to consolidate multiple dashboards into a single platform, supervisors can seamlessly monitor all sites from one centralized location, ensuring streamlined management and quick decision-making.


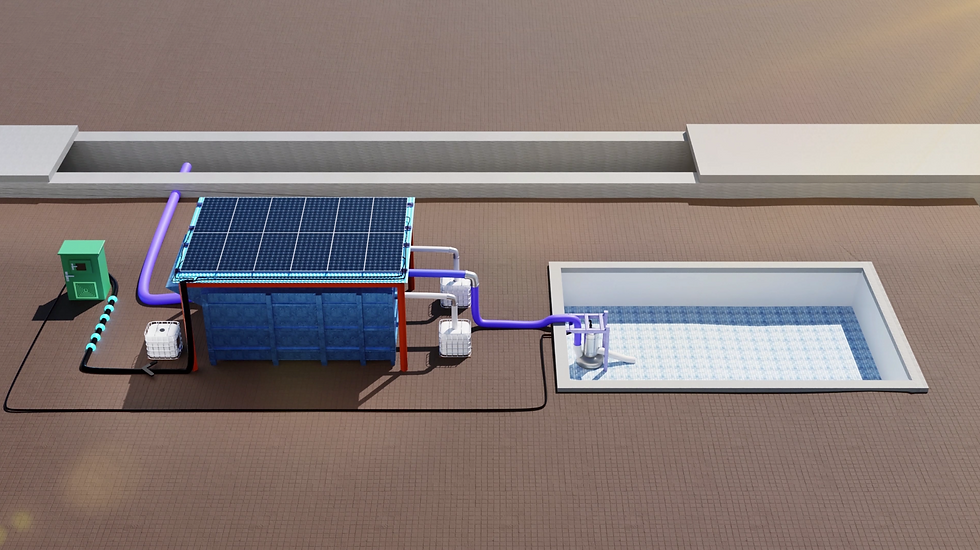
Features
Water Level Sensor
Automatically starts the pump when water reaches 1200 mm and stops at 300 mm.
Dosing Sensors
Monitors two tanks (each 1000 mm). Automatically stops the pump and sends a Telegram notification if either sensor detects levels below 300 mm.
TSS Sensor
Continuously measures Total Suspended Solids (TSS). Automatically stops the pump if TSS exceeds 40 mg/L to prevent unwanted discharge.
Real-Time Monitoring
Tracks water levels, dosing levels, and TSS across all connected sites. Displays data through interactive graphs and sends immediate notifications via Telegram for critical events.
Alerts
WBGT send alert every hours in Telegram and Company & Site Notification.


App Dashboard
Well organized app-based platform and easy to understand dashboard to manage all equipment in one device

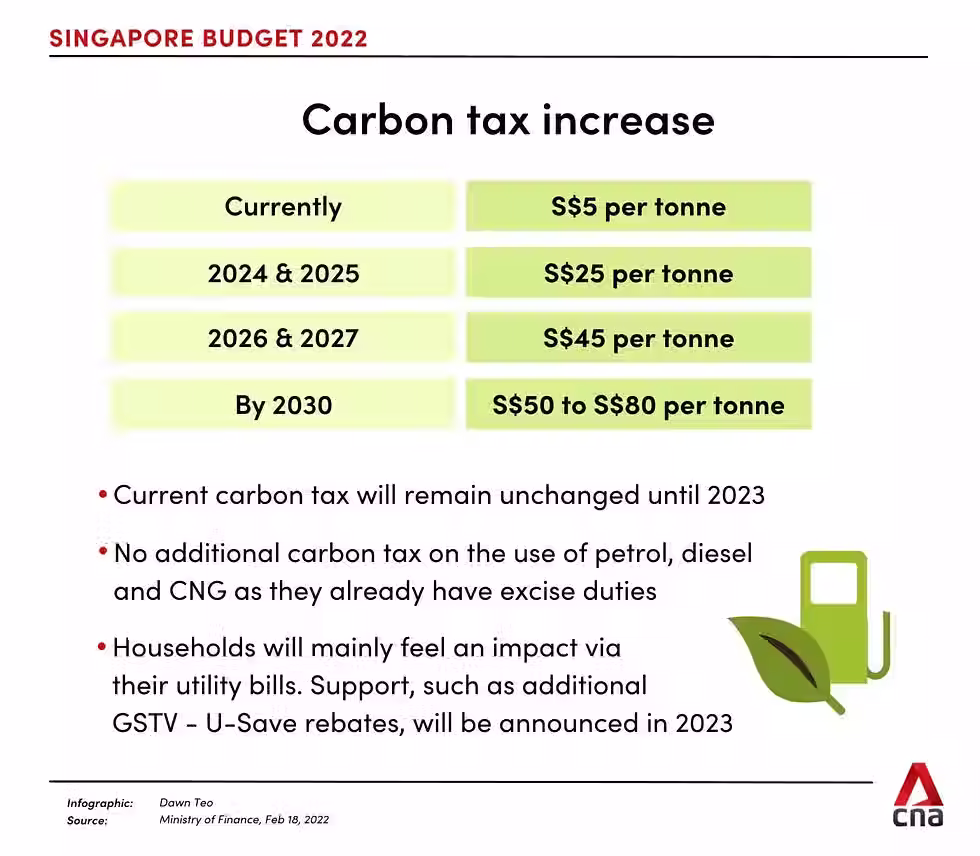
The Peril of Not Measuring: Unlocking Global Sustainability Edge


Unmeasured Impact
Clients and regulators can't see the value you're creating unless it's captured and recorded. Without accurate measurement, your efforts in sustainability and ESG initiatives remain invisible, undermining trust and potential opportunities. Implementing robust tracking systems ensures your impact is quantifiable, enhancing credibility and showcasing your commitment to positive change."

Gathering carbon impact data manually from tools and generators is time-consuming and error-prone. This outdated approach risks inaccuracies, delays, and missed deadlines, leaving your organization exposed to compliance issues. Automating ESG reporting streamlines the process, ensuring reliable data for stakeholders and regulatory requirements."
Manual ESG Reporting

No Verification
Transparency in verification builds confidence by openly showcasing how data is validated. Clear documentation of methods, third-party audits, and real-time tracking fosters trust with clients, regulators, and investors, reinforcing the integrity of your ESG efforts.

You miss out on carbon credit monetization or trade potential—simply because nothing is captured. Without measuring and documenting your carbon impact, valuable offset opportunities slip away, limiting financial and environmental benefits. Proactive tracking ensures you capitalize on these incentives for a greener, profitable future.
Lost Offset Opportunities
.png)